Names the one thing slowing your machine down — and the exact command to fix it.
A single static binary that correlates CPU, memory, disk, network, GPU and local/cloud LLM signals into one ranked verdict, instead of a wall of gauges you have to interpret yourself.
swap 91% full and paging out at 40.00 MB/s — the machine is stalling on disk,
not working — largest consumer: Chrome Helper (Renderer) (pid 4821), 1.20 GB RSS
→ quit or restart Chrome Helper (Renderer) (pid 4821) — the largest consumer, or run vitals memhogs for the full list
→ macOS: sudo purge
✗ verdict: CRITICAL — address the finding above now
exit 2
What it does
One binary. Every resource. One verdict.
vitals reads the same system data htop/btop, ncdu and nvtop already read — it doesn't replace them. What it adds is the layer above: correlating CPU, memory, swap, disk, network, power and GPU into a single ranked list of what's actually wrong, with a concrete fix for each finding, not just a number.
Cross-resource correlation
High CPU that's really disk I/O wait. Swap thrashing vs. reclaimable cache. A single-threaded bottleneck vs. one that needs more cores.
vitals doctor
Local & cloud LLM insight
Per-model GPU VRAM offload percentage for Ollama, LM Studio, llama.cpp and vLLM — plus reachability across 11 open-API cloud providers, only probed when you've set the key.
vitals llm · vitals llm fit <model>
The whole machine on one screen
A verdict-first, single-screen terminal view: the ranked finding up top, then tiled CPU / memory / disk / network / power / GPU panels and the heaviest processes. Bare vitals on a terminal, or vitals view.
vitals view
Apply the fix, with confirmation
Where a finding has a safe, reversible remedy, vitals heal runs it for you — always previewed, always confirmed, from a compile-time allow-list. Everything else stays a printed instruction.
vitals heal --dry-run
A browsable dashboard
The same verdict as loopback-only web pages that refresh themselves in place: a grouped sidebar, a page per resource with the top consumers on each — biggest files, active connections, processes holding VRAM, per-process disk I/O — plus a Containers page, LLM offload and machine details. Opens your browser automatically; nothing leaves your machine.
vitals dashboard
Local containers & Kubernetes
vitals probes a Docker-compatible runtime and a loopback Kubernetes context in one pass, read-only, showing each as its own section — OOM-kills, CrashLoopBackOff, restart loops, published ports, and memory the host process list can't see — with a docker/kubectl command for each.
vitals containers
Safe disk cleanup
Cross-platform cache/log/temp cleanup and byte-identical duplicate detection — always --dry-run first, never deletes without confirmation.
vitals clean --dry-run · vitals dupes
Scriptable by design
Exit codes (0/1/2) for CI and cron, --json with a versioned schema, a Prometheus exporter, and an MCP server for AI coding assistants.
vitals doctor --json | jq
No phone-home, minimal dependencies
gopsutil for system data, plus a small terminal-reliability group for cross-platform color and width detection. No telemetry, no accounts, no network calls unless you point it at an LLM endpoint yourself.
go build -o vitals .
See it
The same verdict, as a local web app
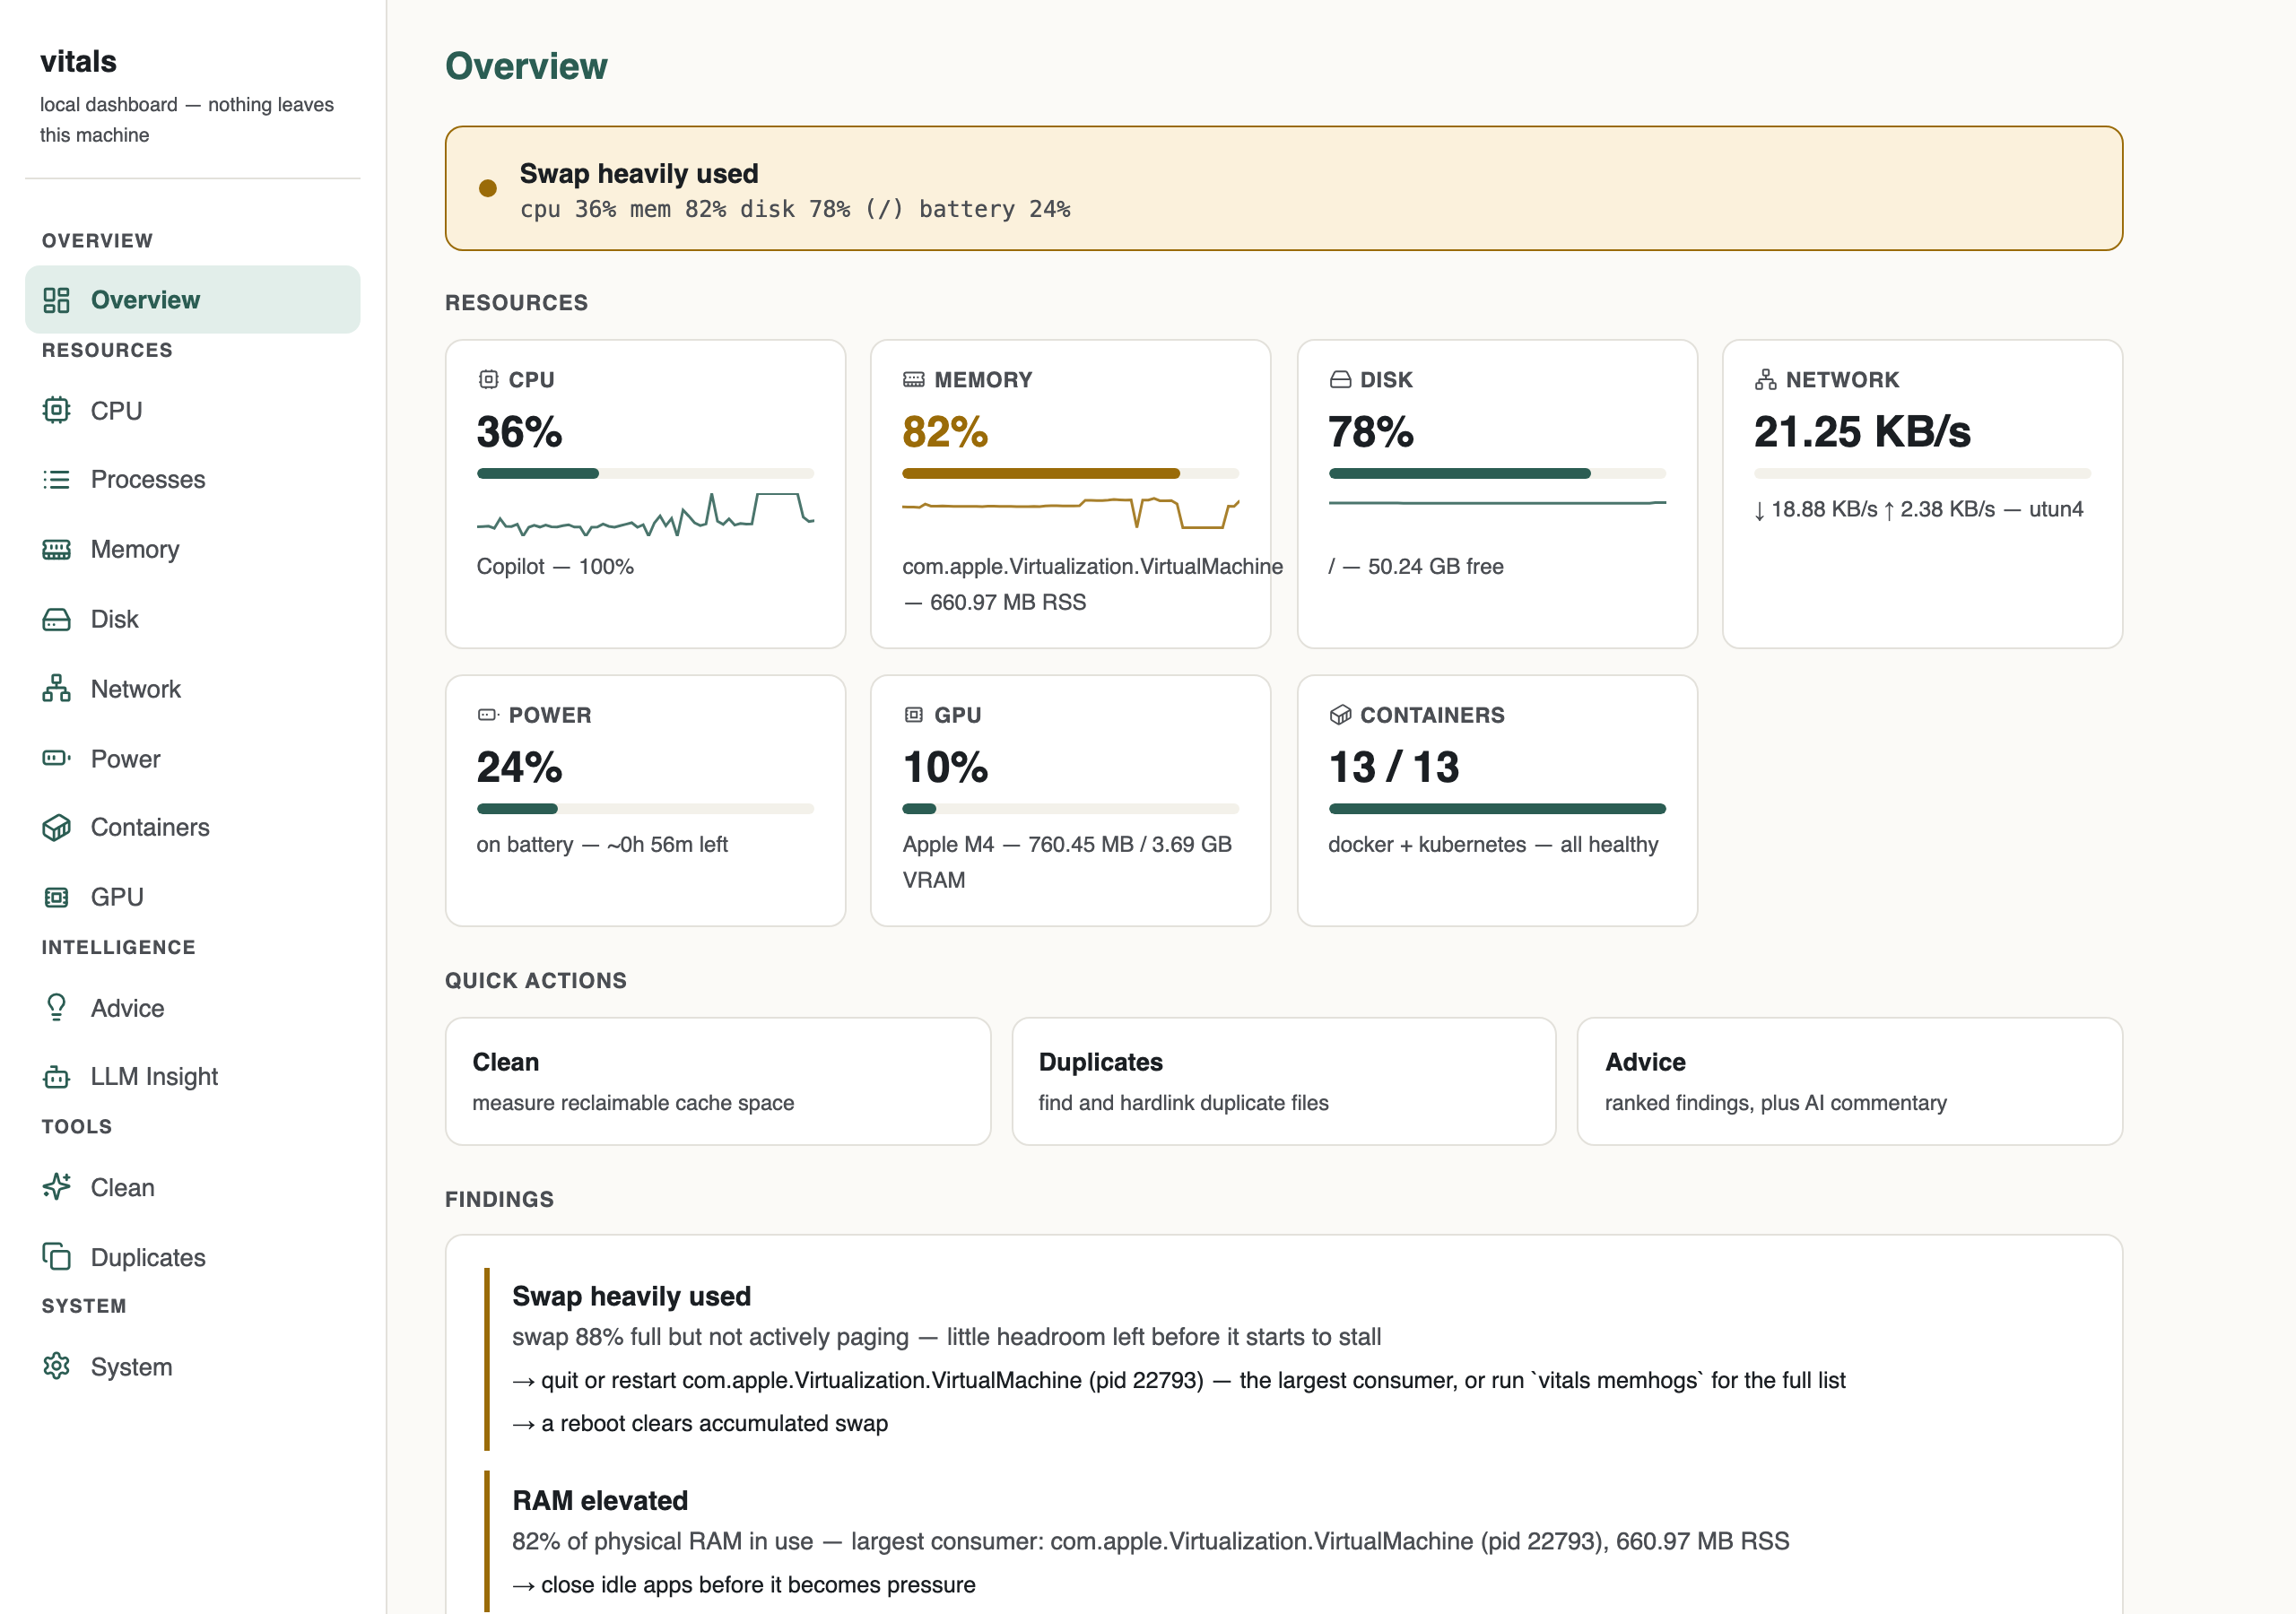
vitals dashboard serves the doctor's correlation as browsable pages — one per resource the machine actually has — on 127.0.0.1 only. Read-only pages refresh themselves in place; nothing leaves your machine.
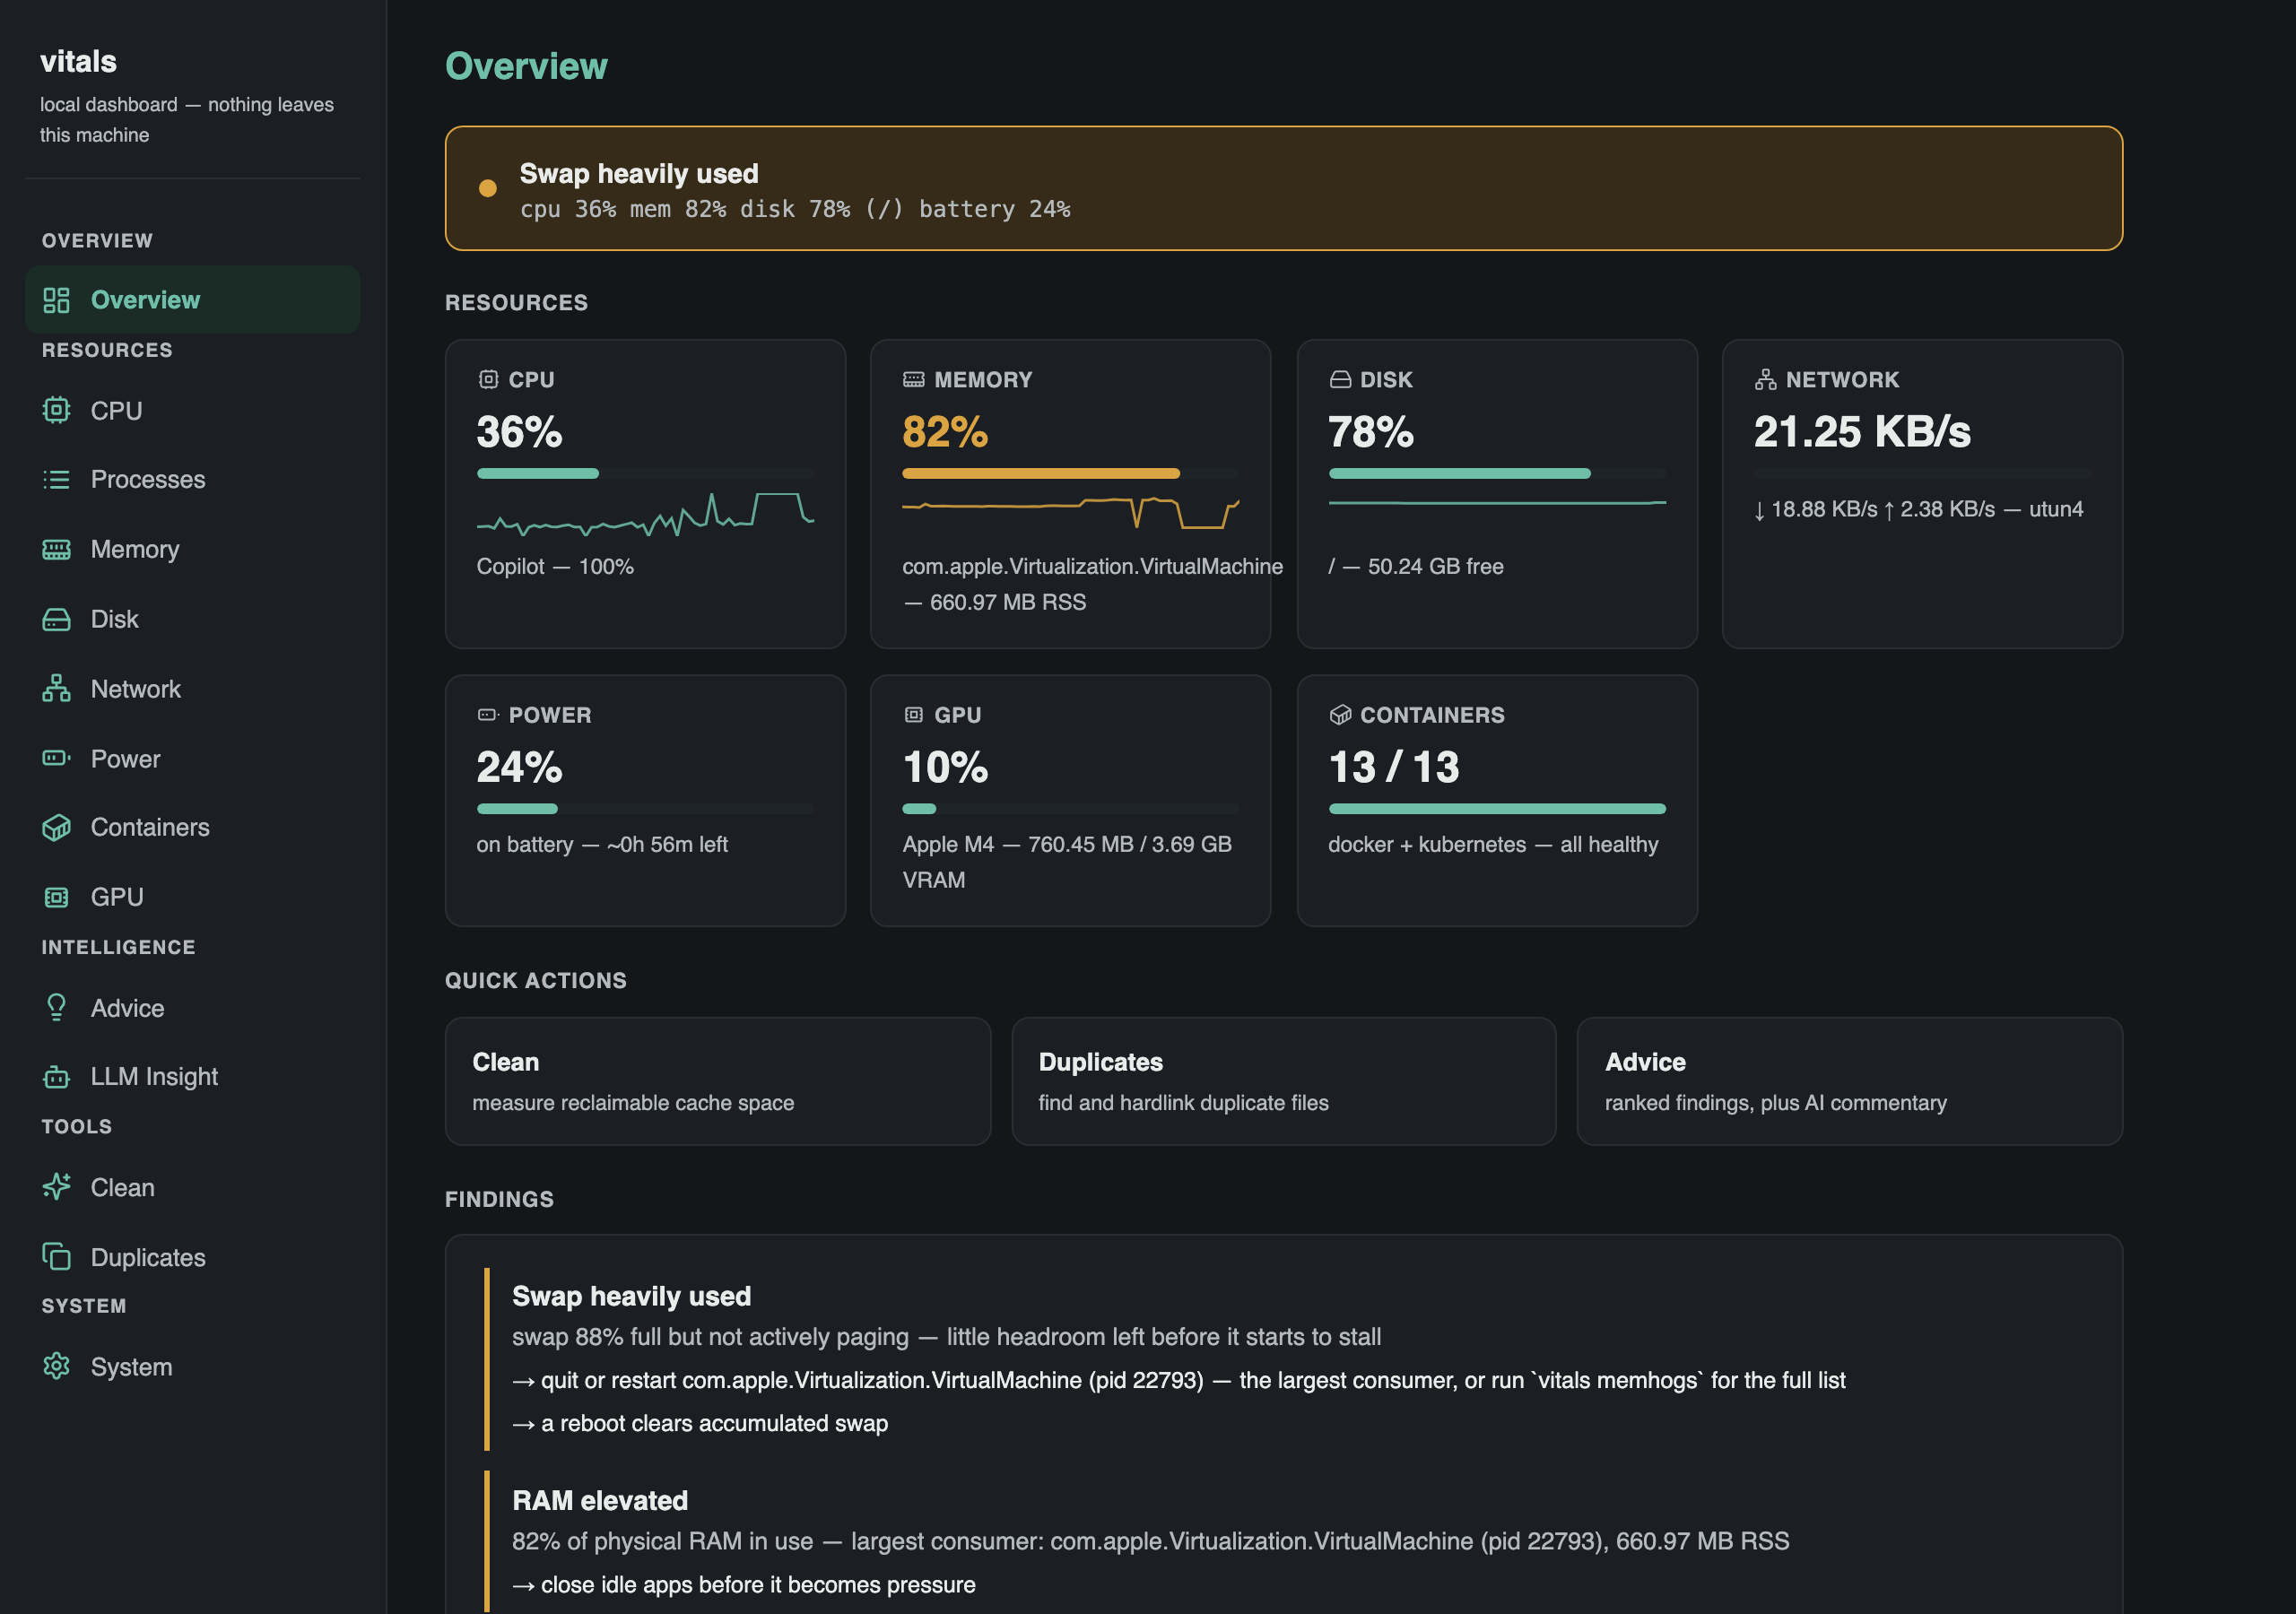
Overview — the verdict, every resource at a glance with 24h trend, and the ranked findings.Follows your system light/dark preference. A grouped, icon-led sidebar reaches every resource page, plus Processes, Containers, LLM Insight and System. The Containers card sums running / unhealthy across Docker and a local Kubernetes context.
Real screenshots of vitals dashboard at v0.10.0 — regenerated when the layout changes (scripts/site-screenshots.mjs).
How it fits alongside what you already use
Complements, not a replacement
Each of these tools does one job well. vitals doesn't try to out-gauge them — it adds the correlation and remediation layer none of them provide on their own.
Tool
What it's for
What vitals adds
htop / btop
Live per-process CPU, memory and load, interactively.
Explains why a number is high (I/O wait vs. real compute) and what to do about it.
ncdu / gdu / dust
Interactive disk-usage browsing, directory by directory.
A one-line disk verdict correlated with the rest of the machine, plus safe automated cleanup and duplicate detection.
nvtop
Live GPU utilization and VRAM per process.
Per-model LLM offload percentage specifically, and whether a model is silently running CPU-only.
glances
A single-screen overview of most system metrics at once.
vitals view gives the same one-screen layout but leads with a ranked verdict, not a grid of numbers — plus JSON/Prometheus output and exit codes for automation.
This table describes each tool's own core purpose as of vitals v0.10.0 — check each project's own docs for its current full feature set.
Install
Get started
macOS / Linux
brew install gautampachnanda101/tap/vitals
# or, without Homebrew:
curl -fsSL https://raw.githubusercontent.com/gautampachnanda101/vitals/main/install.sh | sh